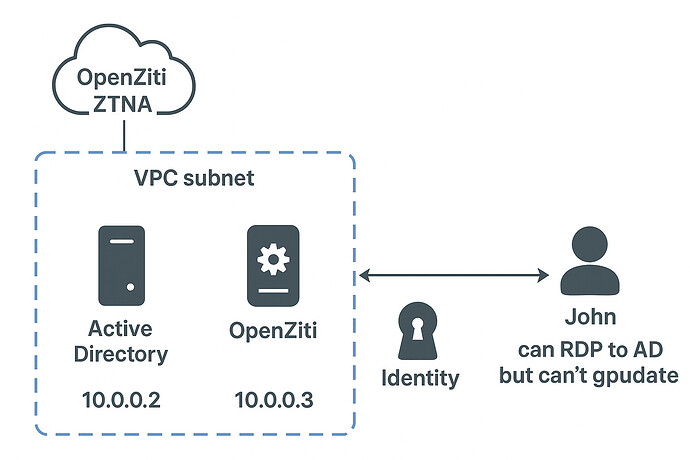
Issue with DNS Interception — Traffic Not Routing Through AD DNS

Thanks for the logs from your current setup. I can see that the tunneler is handling your AD service now, and I can see your controller/router hostnames are in the .io tld.

I also see the problem that’s preventing the tunneler from forwarding DNS queries for your AD domain:

DEBUG ziti-sdk:ziti_ctrl.c:502 ctrl_body_cb() ctrl[https://zc.example.io:1280] completed POST[/sessions] in 0.048 s
DEBUG ziti-sdk:connect.c:486 connect_get_net_session_cb() conn[3.0/3Uqeeklu/Connecting](example-ad-service) got session[cmhokm90h04ayo1kl3fxi42w3] for service[example-ad-service]
DEBUG ziti-sdk:posture.c:210 ziti_send_posture_data() ztx[3] posture checks must_send set to TRUE, new_session_id[FALSE], must_send_every_time[TRUE], new_controller_instance[FALSE]
DEBUG ziti-sdk:connect.c:550 process_connect() conn[3.0/3Uqeeklu/Connecting](example-ad-service) starting Dial connection for service[example-ad-service] with session[cmhokm90h04ayo1kl3fxi42w3]
DEBUG ziti-sdk:connect.c:408 ziti_connect() conn[3.0/3Uqeeklu/Connecting](example-ad-service) selected ch[router2@tls://zr.example.io:3022] for best latency(27 ms)
DEBUG ziti-sdk:channel.c:238 ziti_channel_add_receiver() ch[1] added receiver[0]
ERROR ziti-sdk:connect.c:1068 connect_reply_cb() conn[3.0/3Uqeeklu/Connecting](example-ad-service) failed to connect, reason=no controller available, cannot create circuit
DEBUG ziti-sdk:connect.c:323 complete_conn_req() conn[3.0/3Uqeeklu/Disconnected](example-ad-service) Disconnected failed: connection is closed
ERROR tunnel-cbs:ziti_dns.c:689 on_proxy_connect() failed to establish proxy resolve connection for domain[*.example.com]
DEBUG tunnel-cbs:ziti_dns.c:733 on_proxy_write() proxy resolve write: -24
WARN tunnel-cbs:ziti_dns.c:737 on_proxy_write() proxy resolve write failed: connection is closed/-24

This error comes from the edge router:

failed to connect, reason=no controller available, cannot create circuit

So we’ll need to look at the router configuration and logs to get a better understanding. My hunch is that the router is unable to connect to the ziti controller. Perhaps this router was enrolled with the controller’s previous ‘.com’ tld?

I created a new EC2 instance for the AD setup and used example.io for both controller and router enrollment, to avoid any certificate or key issue. I’ll Mail you the router configuration router logs for this new setup.

Thanks for sending the router and remote tunneler logs. The router logs seem to be truncated though. Specifically the lines are truncated to 209 characters, and there are only 50 lines. I did see something interesting in the tunneler logs which may fully explain why your service isn’t working. If you need to send router logs again it will be more helpful if you send the full and un-truncated log.

As for your tunneler log, it seems that somehow your hosting tunneler’s identity has been disabled:

WARN tunnel-cbs:ziti_tunnel_ctrl.c:995 on_ziti_event() ziti_ctx controller connections failed: ziti context is disabled
ERROR ziti-edge-tunnel:ziti-edge-tunnel.c:494 on_event() ztx[/opt/openziti/etc/identities/ziti-id.json] failed to connect to controller due to ziti context is disabled

You can enable the identity with this:

ziti-edge-tunnel on_off_identity --identity /opt/openziti/etc/identities/ziti-id.json --onoff true

root@ip-10-0-0-1:/home/ubuntu# ziti-edge-tunnel on_off_identity --identity /opt/openziti/etc/identities/ziti-id.json --onoff true
ziti-edge-tunnel: command not found


I have followed the linux deployment without docker and Also i have re-mailed the router logs.

/opt/openziti/bin/ziti-edge-tunnel Use sudo if you get a permission error.

I already have root privileges. I also tried sudo but same “command not found”

You had previously sent me some logs from your remote tunneler. The commands that I’m asking you to run now should be performed on the host where you produced those logs.

Yes the client who is in the AD, has ran the commands and he sent me those logs. Do you need me to run those commands again and send you back?

Resolve-DnsName _ldap._tcp.dc._msdcs.example.com -Type SRV

I'll run this command and will give the router and tunneler logs from the client machine. If there are other commands pls do let me know.

The logs that I’m referring to apparently came from a host named dtn-003:

Feb 26 16:48:48 dtn-0003.***.com systemd[1]: Starting Ziti Edge Tunnel...
Feb 26 16:48:48 dtn-0003.***.com ziti-edge-tunnel.sh[955]: NOTICE: no new JWT files in /opt/openziti/etc/identities/*.jwt
Feb 26 16:48:48 dtn-0003.***.com systemd[1]: Started Ziti Edge Tunnel.
Feb 26 16:48:48 dtn-0003.***.com ziti-edge-tunnel[964]: About to run tunnel service... ziti-edge-tunnel
Feb 26 16:48:48 dtn-0003.***.com ziti-edge-tunnel[964]: (964)[        0.050]    WARN tunnel-cbs:ziti_tunnel_ctrl.c:995 on_ziti_event() ziti_ctx controller connections failed: ziti context is disabled
Feb 26 16:48:48 dtn-0003.***.com ziti-edge-tunnel[964]: (964)[        0.050]   ERROR ziti-edge-tunnel:ziti-edge-tunnel.c:494 on_event() ztx[/opt/openziti/etc/identities/ziti-id.json] failed to connect to controller due to ziti context is disabled
Feb 26 17:30:13 dtn-0003.***.com ziti-edge-tunnel[964]: (964)[     2484.040]    INFO ziti-sdk:utils.c:198 ziti_log_set_level() set log level: root=4/DEBUG

The identity that this tunneler is using has been disabled. The commands I’ve requested you to run will re-enable it.

If you are referring to this command

ziti-edge-tunnel on_off_identity --identity /opt/openziti/etc/identities/ziti-id.json --onoff true

I ran it on the server which ziti is deployed, I am not sure what this dtn-003 is.

You’d need to run it on the host that’s running the ziti-edge-tunnel. Typically you would not run ziti-edge-tunnel on your controller or router host. I received the “ziti-tunneler.log” from you (in your 11/7 email which also included the router configuration and truncated router logs).

That log showed an identity which is disabled, and your more recent and complete router logs show service has no terminators errors. I’m putting two and two together here, but these two data points suggest that the ziti endpoint which is supposed to be hosting your AD service is not binding the service for one reason or another.

Let’s try going at this from the other direction:

  1. which identity is hosting your AD service?
  2. please provide the (complete and untruncated) logs from whatever client (router or tunneler) is assuming that identity


I hope this makes it clear, John has a windows client identity which is connected to the vpc through ziti, in that 0.2 is the AD and 0.3 has router and controller deployed. i am getting these client logs from john (His client feedback zip) and router logs from openziti server using “journalctl -u ziti-router.service”.
So i need to run the tunneler on command on johns machine right?

Let’s forget about John and wherever the “ziti-tunneler.log” came from. This is what I want:

  1. which identity is hosting your AD service?

  2. the (complete and untruncated) logs from whatever client (router or tunneler) is assuming that identity

Thanks!

The ziti server 0.3 is currently hosting the ad service, that has router and controller deployed in it. It has Ad intercept and host.v1 configs using the wildcard domain and required ports.

Pls note that I already shared last 5 days of untruncated logs of router since I created the new controller and router with .io on 11th November.

I’ll share the full logs from the Ziti tunneler on that node tomorrow with the tunneler on command.

I apologise for any inconveniences from my side

Now this query is resolving


I have mailed the required logs.

Openziti deployment.txt (1.8 KB)
This is how i have deployed Openziti, Using router as tunneler.

Great! If those NameTarget values match the wildcard domain in your service intercept configuration then I’d expect your AD services to be working also?

The “error” from the gpupdate command was clipped out of your screen capture. What was it?

could not update group policy, Network connection issue.

Ok, well at least the SRV queries are going through the tunnel. Here’s one for the domain controller from the ZDEW log:

INFO tunnel-cbs:ziti_dns.c:686 on_proxy_connect() proxy resolve connection established for domain[*.example.com]
DEBUG tunnel-cbs:ziti_dns.c:733 on_proxy_write() proxy resolve write: 135
DEBUG tunnel-cbs:ziti_dns.c:696 on_proxy_data() proxy resolve: {"id":58666,"status":0,"question":[{"name":"_ldap._tcp.Default-First-Site-Name._sites.dc._msdcs.example.com","type":33}],"answer":[{"name":"_ldap._tcp.Default-First-Site-Name._sites.dc._msdcs.example.com","type":33,"ttl":86400,"data":"dc01.example.com.","port":389,"weight":100},{"name":"_ldap._tcp.Default-First-Site-Name._sites.dc._msdcs.example.com","type":33,"ttl":86400,"data":"dc02.example.com.","port":389,"weight":100}]}

This may have been from the query that was initiated on the command line. There are two answers: tcp:dc01.example.com:389 and tcp:dc02.example.com:389.

Right after this we can see the tunneler intercepted a connection for the dc02 hostname on port 389:

DEBUG tunnel-cbs:ziti_dns.c:394 ziti_dns_lookup() matching domain[*.example.com] found for dc02.example.com
INFO tunnel-cbs:ziti_dns.c:349 new_ipv4_entry() registered DNS entry dc02.example.com -> 100.64.0.5
INFO tunnel-cbs:ziti_dns.c:566 format_resp() found record[100.64.0.5] for query[1:dc02.example.com]
...
DEBUG tunnel-sdk:tunnel_udp.c:239 recv_udp() intercepted address[udp:100.64.0.5:389] client[udp:100.64.0.1:55037] service[example-ad-service]
DEBUG tunnel-cbs:ziti_tunnel_cbs.c:354 ziti_sdk_c_dial() service[example-ad-service] app_data_json[181]='{"connType":null,"dst_protocol":"udp","dst_hostname":"dc02.example.com","dst_ip":"100.64.0.5","dst_port":"389","src_protocol":"udp","src_ip":"100.64.0.1","src_port":"55037"}'
DEBUG ziti-sdk:connect.c:431 connect_get_service_cb() conn[1.4/T6x4InG-/Connecting](example-ad-service) got service[example-ad-service] id[50qfJOPxo78O35SPOH8AQv]
...
DEBUG ziti-sdk:connect.c:550 process_connect() conn[1.4/T6x4InG-/Connecting](example-ad-service) starting Dial connection for service[example-ad-service] with session[cmhu89fcw7g3qo1kli9bg6nux]
DEBUG ziti-sdk:connect.c:408 ziti_connect() conn[1.4/T6x4InG-/Connecting](example-ad-service) selected ch[router2@tls://zr.example.io:3022] for best latency(21 ms)
DEBUG ziti-sdk:channel.c:238 ziti_channel_add_receiver() ch[2] added receiver[4]
DEBUG tunnel-sdk:ziti_tunnel.c:221 ziti_tunneler_dial_completed() ziti dial succeeded: client[udp:100.64.0.1:55037] service[example-ad-service]

This connection was probably initiated by gpupdate. It was successful (at least as far as ziti is concerned), but we don’t know how much data was transferred over it at this log level. So based on the activity in the logs it looks like you’re close to having this working.

I did notice that the ZDEW identity was disabled and re-enabled a few times, and I wonder if this may have created a problem for you. Long explanation - when the tunneler intercepts a wildcard domain, it assigns IPs for hostnames within that domain as they are queried. So looking up e.g. dc02.example.com for the first time causes the tunneler to map an IP address to that hostname - something like 100.64.0.4. When an identity is disabled (or the service for which the wildcard existed is removed for any reason), the tunneler forgets all of its wildcard domain IP mappings but the counter used for generating new IPs is not reset. So the identity with access to a wildcard domain is re-enabled, the next query for dc02.example.com might return 100.64.0.8. There’s a chance that this is affecting your ZDEW client. Restarting the tunneler using the on/off button is the easiest remedy.

If that doesn’t solve it for you then the next thing I can think of is getting a packet capture (Wireshark) from the host that’s running ZDEW. If that is too challenging due to user permissions, technical ability, or whatever, then the next best thing would be seeing the tunneler logs increased to TRACE level.

I mailed the packet capture file and trace level logs.

Thanks for the pcap. It looks like the packet capture was done after the tunneler logs ended, so I can’t correlate connections that I see in the pcap with messages that I see in the tunneler log. In fact all of the frames that I see in the pcap are on the host’s wifi interface. Maybe the capture was filtered for that interface only? Or maybe the tunneler wasn’t running when the capture was recording?